Global Land Use for Food Production
INFOGRAPHICS
5/20/2024
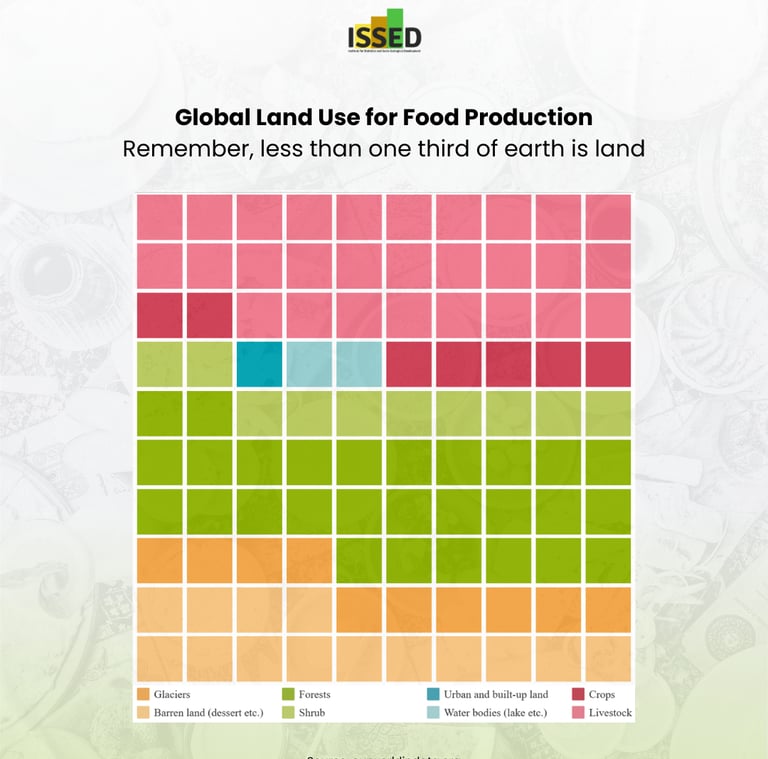
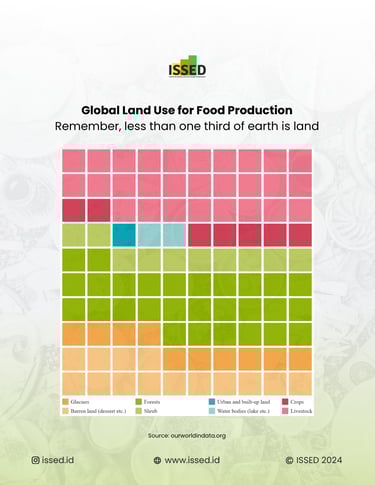
This “waffle" chart presents a detailed overview of global land use for food production, categorizing various types of land. The largest portion is dedicated to livestock, represented by the pink squares. This highlights the significant space allocated to raising animals for meat, dairy, and other animal products. Following livestock, the chart shows that a substantial amount of land is also used for growing crops, indicated by the dark pink squares. Together, these categories illustrate the dominant role of food production in global land use, emphasizing the vast areas required to meet human dietary needs.
In contrast, smaller portions of the land function as forests (green squares), barren land (orange squares), and water bodies (blue squares). Forests, while not directly related to food production, play a crucial role in maintaining ecological balance and supporting biodiversity. Barren lands, which include deserts and other unproductive areas, do not contribute to food production but are important in understanding the limitations of arable land. Urban and built-up areas, represented by the dark blue squares, show the space taken up by human settlements and infrastructure, which further competes with land available for food production.
Humans have used 35% of the Earth's land for food production. This area, equivalent to over 5 times the size of the United States or 12 times the size of Indonesia, is mostly not directly consumed by humans but used for biofuels, industrial products, and livestock feed. Notably, only 3% of this land is used for crops directly consumed by people. This chart also emphasizes the importance of shifting towards plant-based diets and improving land productivity to reduce the environmental impact of food production. This change is essential for preserving biodiversity, as food production is a major driver of biodiversity loss world-wide.
Interactive dashboard (here)