Tableau Online Workshop in Celebration of International Love Data Week 2024
3/17/20242 min read
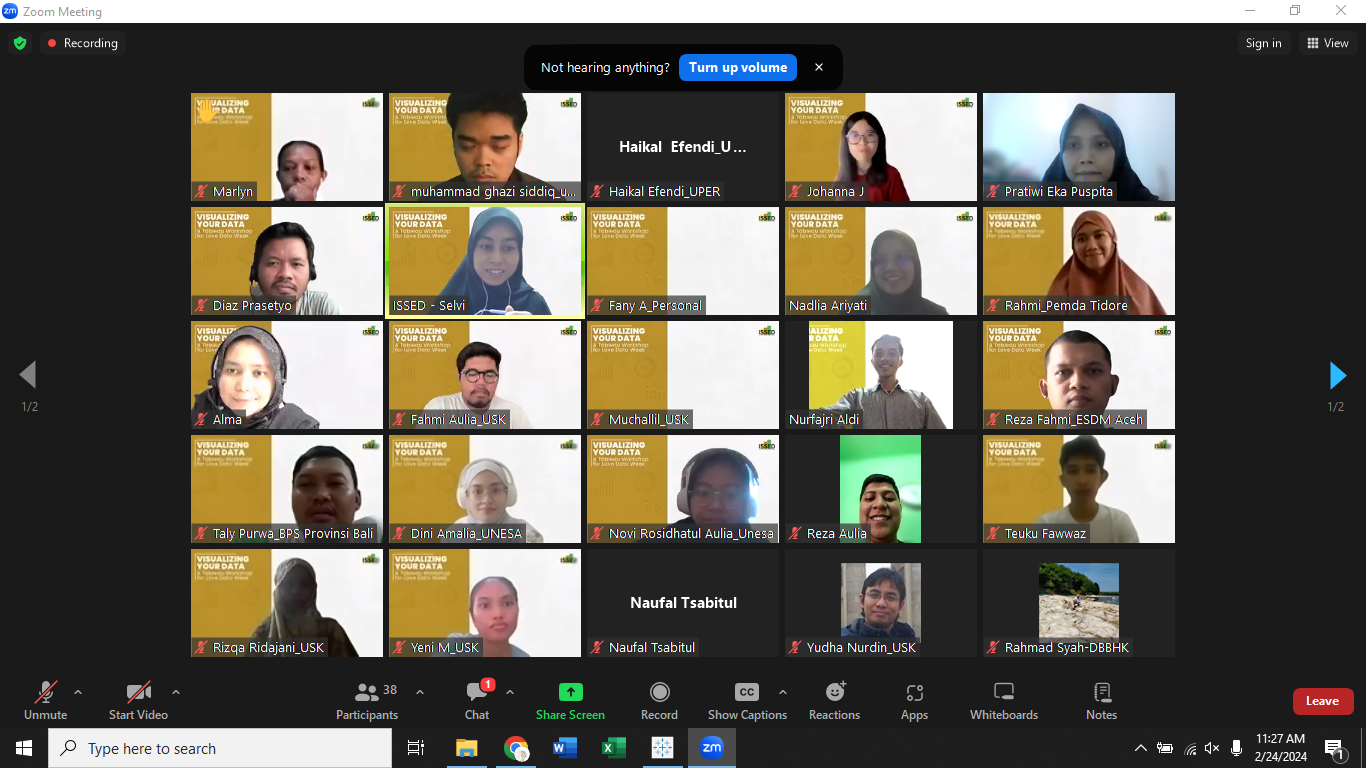
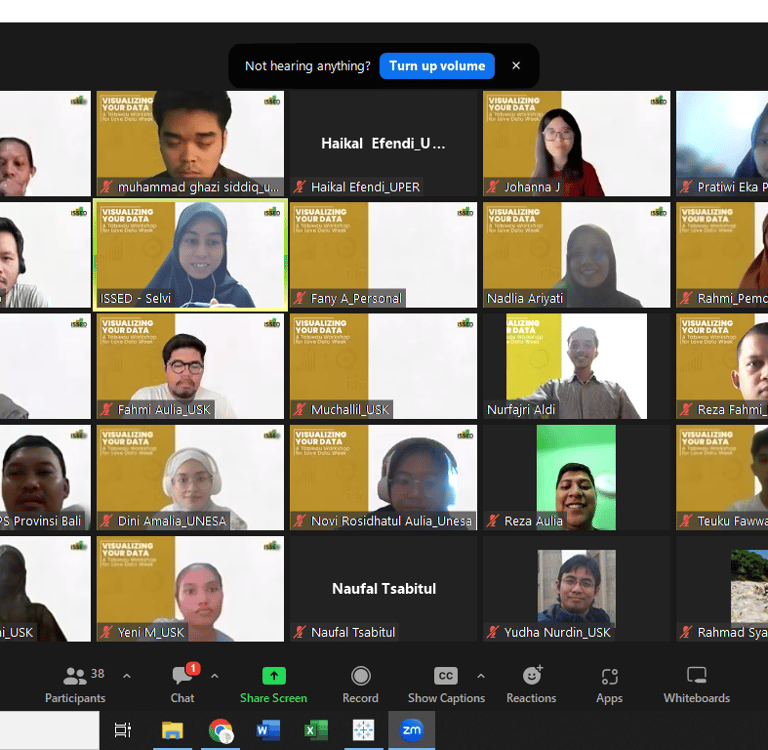
Banda Aceh, 14 March - ISSED recently conducted Visualizing Your Data "A Tableau Workshop for Love Data Week," an online training to commemorate International Love Data Week on 23-25 February 2024. The event was attended by 53 participants from various educational and professional backgrounds, including students, lecturers, and professionals from various fields including statistics, health, accounting, management, forestry, and others. Participants came from various regions in Indonesia, such as Aceh, North Sumatra, West Sumatra, West Java, DI Yogyakarta, Central Java, East Java, East Nusa Tenggara (NTT), Bali, and North Maluku. Each day of the workshop was guided by expert speakers in their fields, who provided informative and inspiring material to the participants:
Day 1 (February 23, 2024): Diaz Prasetyo, S.T
The first day focused on the introduction of tools and basic training in data visualization using Tableau. Diaz Prasetyo, S.T, a Master of Data Science Student and Tableau Student Ambassador, guided participants from the basics of getting to know and using Tableau, and shared insights on techniques for using Tableau to produce effective data visualizations.
Day 2 (February 24, 2024): Johanna Josodipuro, S.E, M. Commerce
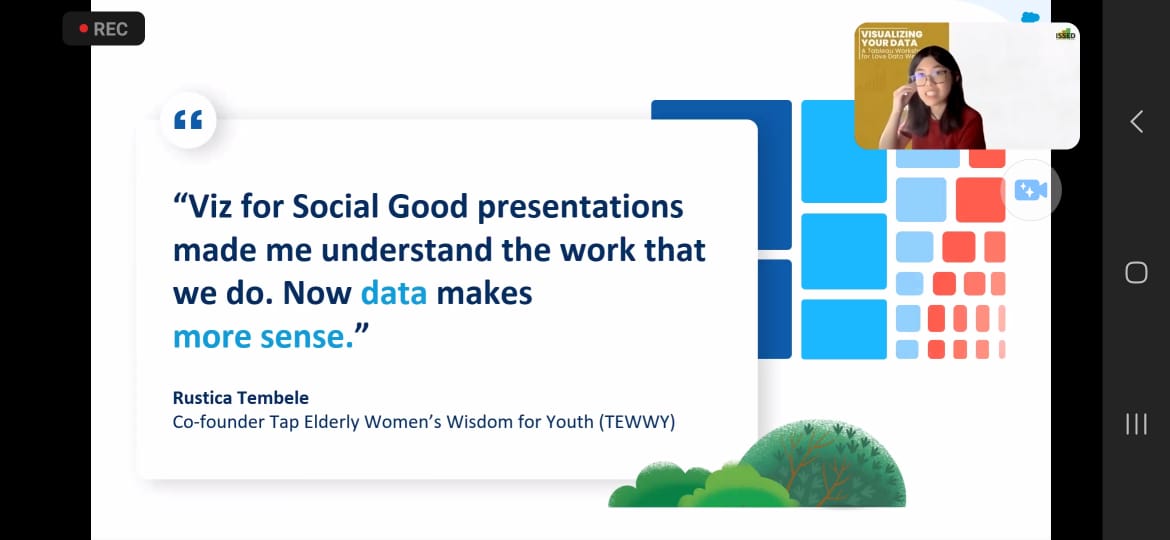
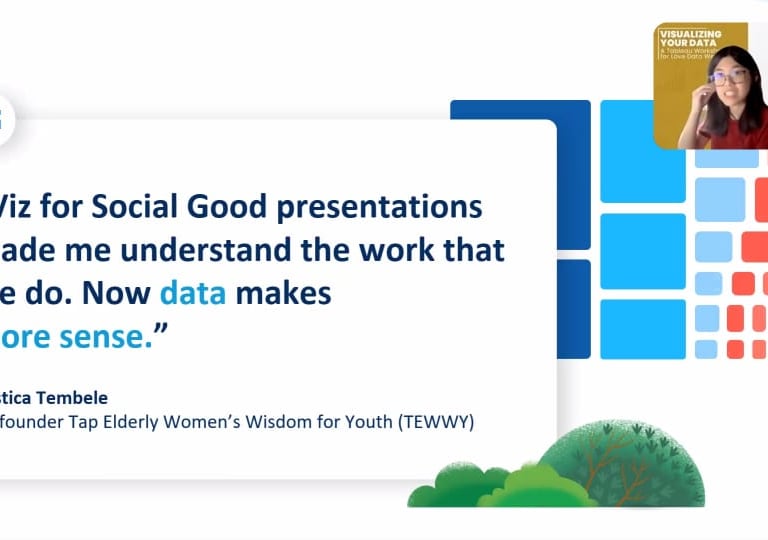
On the second day, Johanna Josodipuro, a Data Analytics Consultant and Tableau Public Ambassador, discussed the topic "Viz for Social Good." This material provided a perspective on how data visualization can be used for positive social purposes and bring significant impact in society.
Day 3 (February 25, 2024): Cut Famelia, S.Si, M.Sc
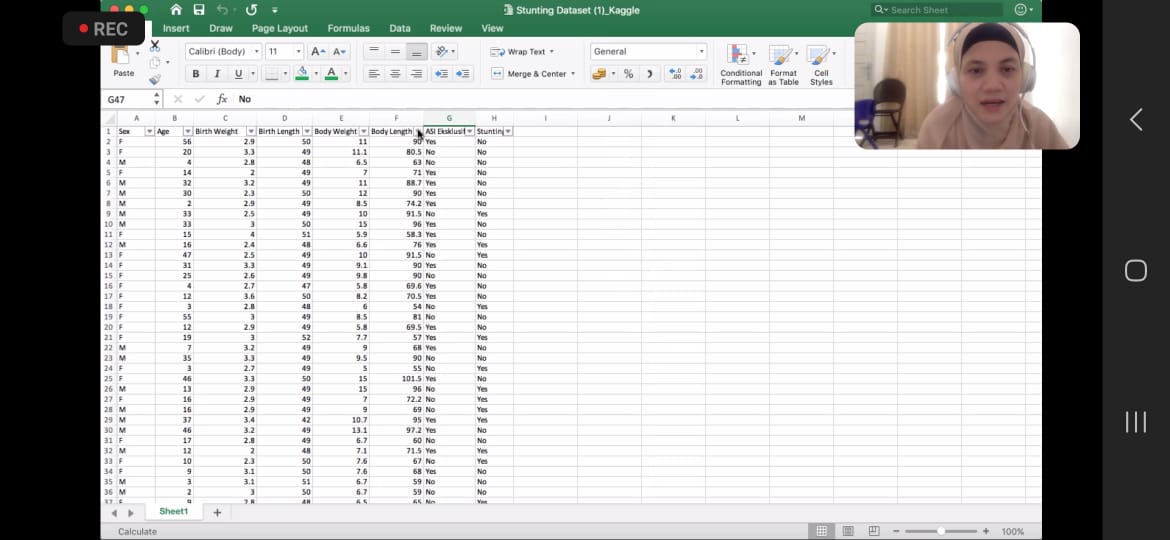
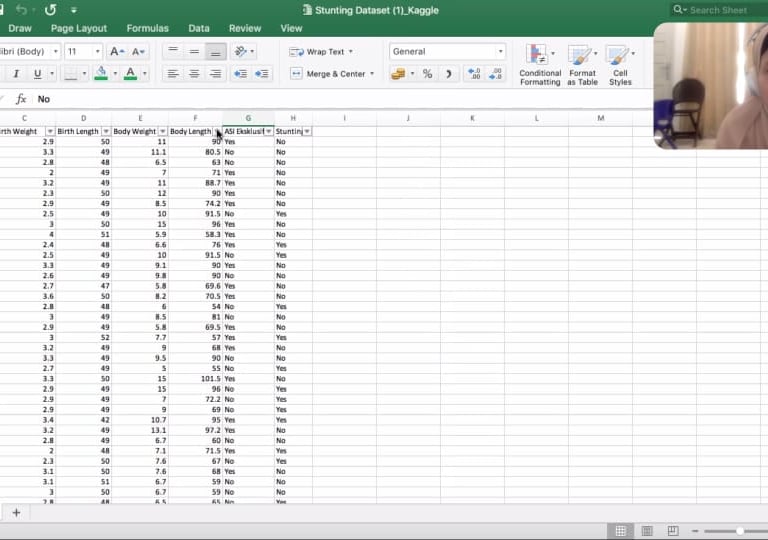
The last day was filled with a session from Cut Famelia, a Data Scientist and Fulbright Scholar, who guided participants in the session "Visualize and Data Storytelling with Stunting Data". This material invites participants to understand data visualization methods known as "storytelling", which is how to present data so that it can be well understood by its readers. Participants were invited to practice directly using stunting data that is relevant to public health issues.
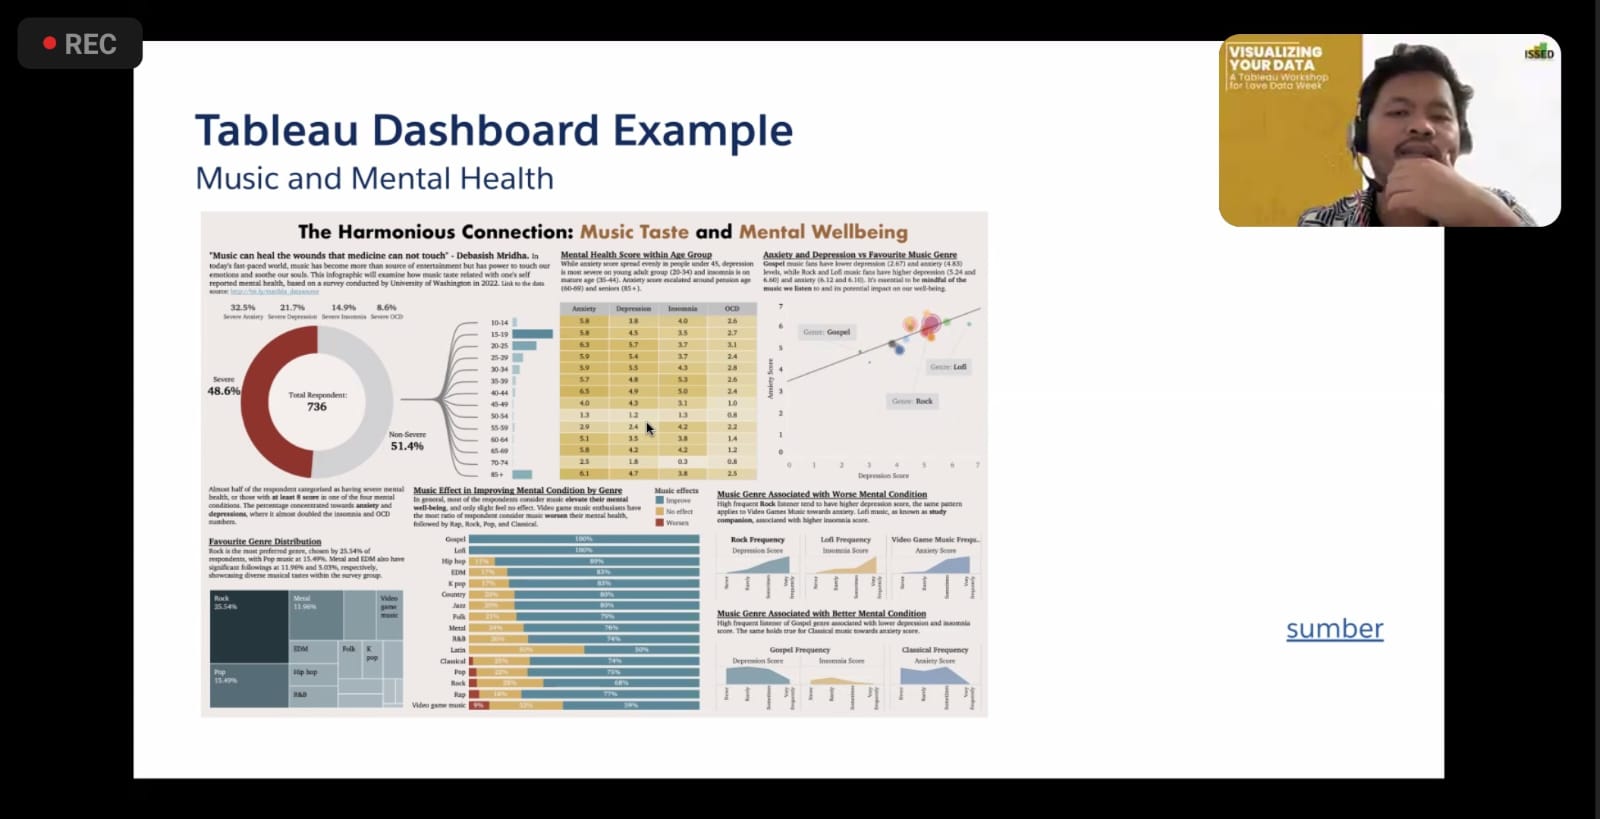
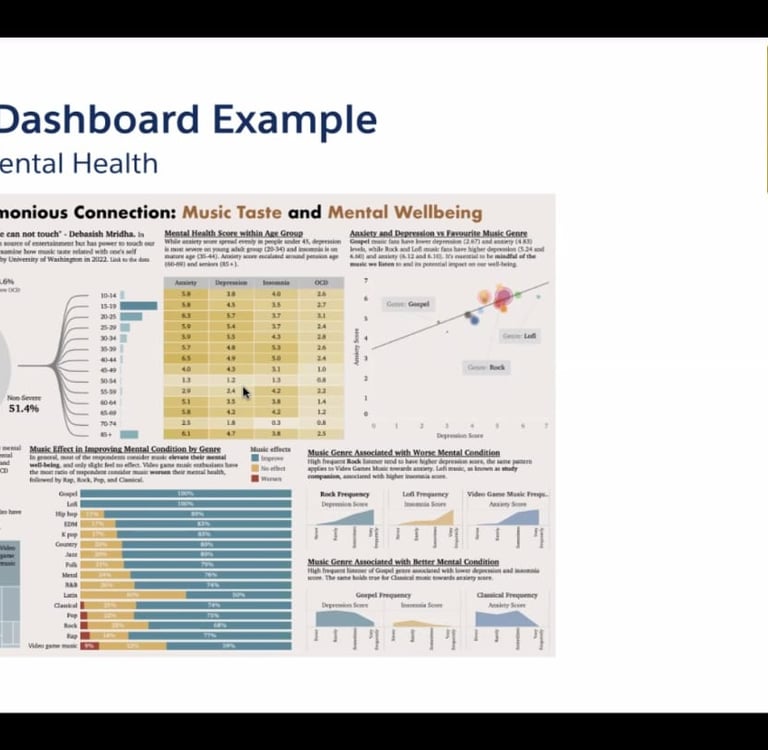
During the workshop, participants not only gained new knowledge, but also practiced directly in creating dashboards using Tableau. After the series of training was completed,participants were asked to compete for Best Tableau Dashboard. There were 15 participants who made dashboards. Then, the best 4 dashboards were selected by a panel of speakers to be uploaded to ISSED Instagram, and one winner was chosen based on the most votes. All dashboards created by participants can be accessed through our website.
ISSED hopes that this event will have a positive impact and become a source of inspiration for participants and people who pursue the field of data visualization.